One blood draw becomes a report you can read in ten minutes and act on for months. This page walks through our example report for Ryan, 36, one section at a time.
140 biomarkers, clinic blood draw included, report within 4 working days.
RyanFirst test. 140 biomarkers from one blood draw.
Ageing 4.4 years younger than the calendar, from nine markers of inflammation, metabolism and blood health.
The report opens with the summary a busy person needs. TrueScore rates your whole panel out of 100. PhenoAge estimates how old your blood says you are. The Cardiovascular Risk Score puts the heart markers into one figure.
Ryan is 36. His blood reads younger than that, yet his TrueScore is held back by a single hormone result. That is the kind of thing a list of numbers hides.
Every marker is scored on how far it sits from its ideal range, then combined by body system, with the systems that matter most for long-term health weighted highest.
A published biological age estimate (Levine, 2018) calculated from nine routine blood markers, including albumin, glucose, hs-CRP and red cell distribution width.
A TrueVitals composite of the blood markers that predict heart disease. ApoB carries the most weight, then Lp(a), hs-CRP and the triglyceride to HDL ratio.
Use the switch at the top of the page to see the same numbers three months later.
Each system is coloured by how much it matters right now, not by how many numbers sit outside a range. Fourteen systems, each with a one-line verdict in plain words.
In the report you tap any system to jump straight to its markers.
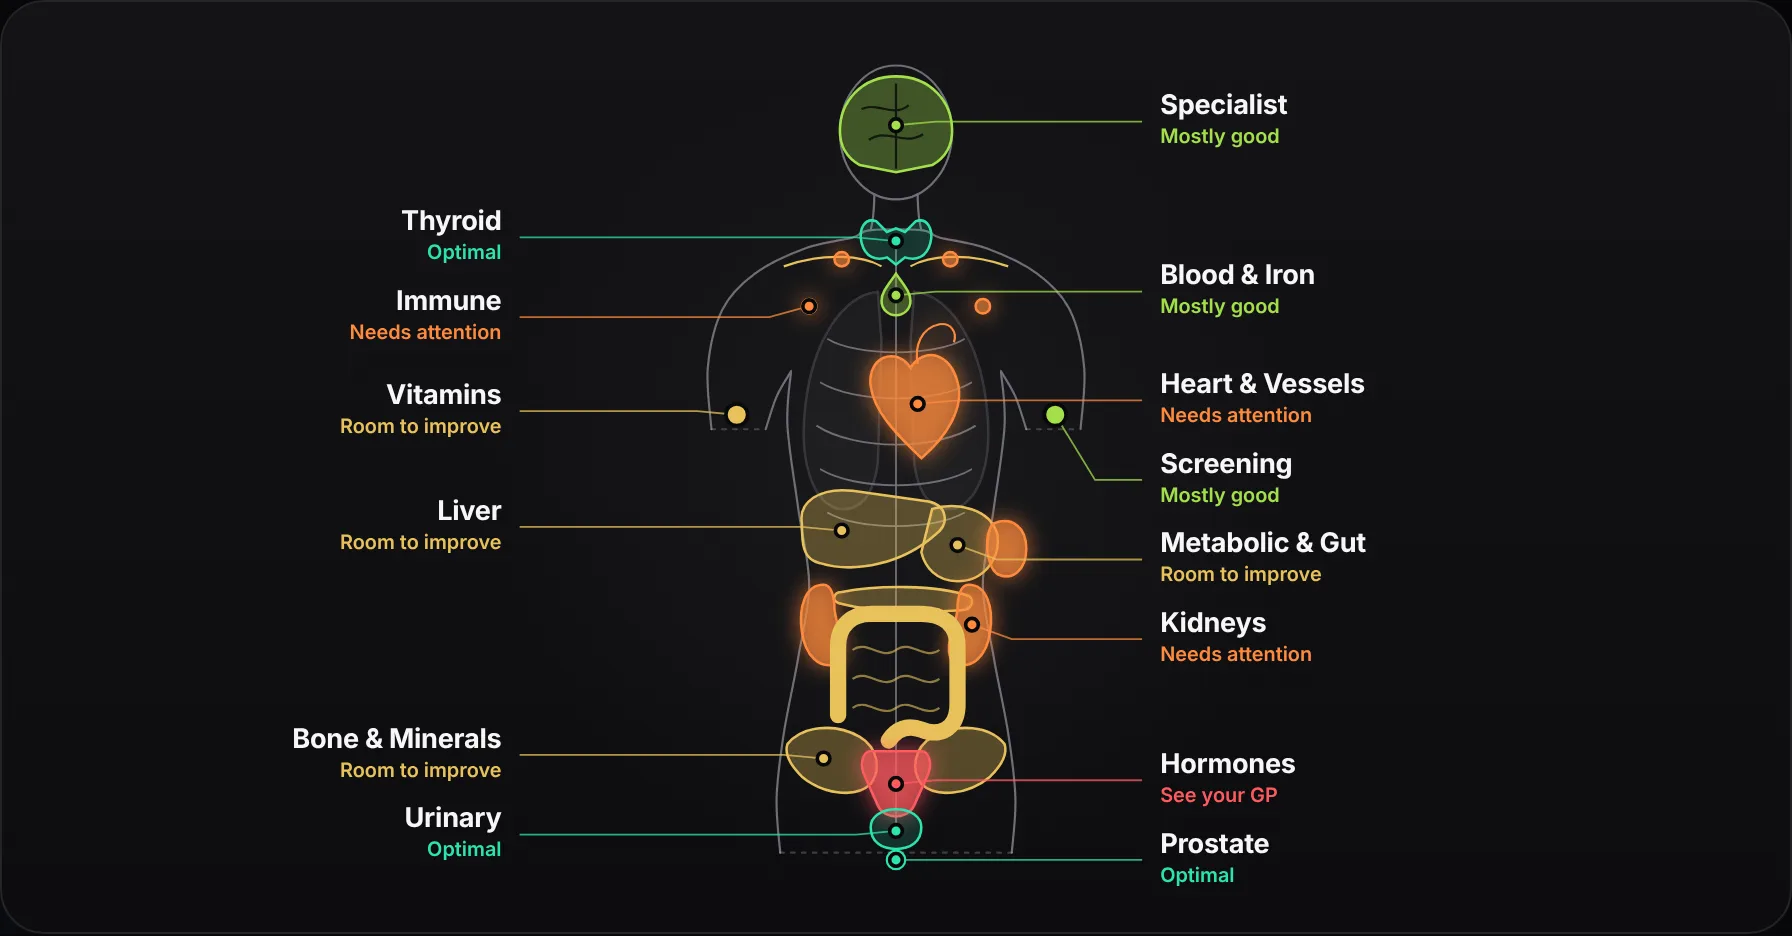
Testosterone below range at 36, cortisol near the floor
ApoB 1.35 and LDL 4.21, diet-driven and modifiable
Cystatin C above range, early reduction, hydration
IgE 554, strong allergic burden; coeliac and RF clear
Enzymes above ideal, no scarring on any score
HbA1c 40 approaching 42, insulin output low
A laboratory range tells you whether a result is abnormal. It does not tell you whether it is good. Each marker in the report sits on a bar showing both: the laboratory range, and the tighter optimal band inside it.
A standard results sheet would mark three of these four as normal. Open any row to read what the report says about it.
Below range at 6.2 (limit 8.4). Genuinely low at 36. Driven by excess body weight, zero exercise, poor sleep, and caffeine overuse. Directly explains joint pain, poor recovery, and poor sleep.
Below optimal at 67. For optimal energy and recovery, above 80 is ideal.
Below optimal at 71. Supports joint health, sleep, mood, and immune function.
At 40 (5.8%), approaching the prediabetic threshold of 42 (6%). Takeaway diet driving blood sugar trajectory.
Four of the 140 markers in Ryan's report. The full list is searchable and grouped by system.
This is the part most blood tests leave out. The report reads your results against each other and against your lifestyle quiz, then explains in plain English what is driving what.
The passage shown is taken word for word from Ryan's report.
The blood results are telling a clear story, and the positive message is that nearly everything flagged in this report is modifiable. There is no genetic cholesterol problem (Lp(a) 25 is normal), no autoimmune condition, no liver scarring, and no established kidney damage.
What the results show is a body at 36 that is being progressively undermined by three things: the diet, the caffeine dependency, and the absence of exercise.
The most impactful single change would be breaking the caffeine and energy drink cycle. Caffeine blocks a brain chemical called adenosine, which builds sleep pressure during the day.
Anything worth a medical conversation is pulled into its own section, with the value, the laboratory limit and the likely cause. The report prints cleanly or saves as a PDF, so you can take it to your appointment.
Results that are reassuring are listed too, so you know what was checked and came back clear.
Calculated free testosterone 0.124 (below range). SHBG ideal. Genuinely low at 36. Driven by excess body weight, zero exercise, poor sleep, and caffeine overuse. GP discussion recommended.
Reduced kidney function at 36, likely driven by energy drink overuse and high-sodium diet. Microalbumin and ACR normal (early warning stage). GP discussion recommended.
Two of the flags from Ryan's first report, as written.
Each habit is one specific change, tied to something you already do, with the reason it moves your numbers. Supplements come with a dose and the result they are for.
The report is honest about priorities. Ryan's says: the most impactful interventions are not supplements.
Anchor: the takeaway app comes off the phone home screen on Sunday.
Why: one cooked meal a day replaces the highest-salt, highest-fat meal of his day, and GGT and triglycerides respond to that within weeks.
Anchor: swap the afternoon can for a large glass of water and a walk to get it.
Why: caffeine after lunch is the single most likely cause of the insomnia he reports, and poor sleep is what holds his testosterone below range and his cortisol high.
Your second report is a progress report. Every marker is compared with your last result, and the write-up tells you what worked, what did not, and what to change next.
Ryan retested after three months. Most things improved. One went the wrong way, and the report says so.
69 to 84 out of 100
6.2 to 10.8 nmol/L, back in range
1.35 to 1.12 g/L, still above 0.9
54 to 34 IU/L
71 to 98 nmol/L
67 to 58 ng/mL, moved the wrong way
The shaded band is the optimal range. Ferritin fell after he started training, so the second report adds iron to the plan.
Every panel comes with the full report. The more markers you test, the more it has to work with.
£319
74 biomarkers
£399
140 biomarkers (139 for women)
£799
230 biomarkers
Not sure which panel fits you? Take the free 3-minute quiz or compare the panels.
Every report has a TrueScore out of 100, a PhenoAge biological age estimate, a body map rating each system, every biomarker shown against both the laboratory range and a tighter optimal range, a written summary that connects the results to your lifestyle quiz, flags to raise with your GP, and specific lifestyle and supplement guidance.
An AI model reads all of your results together with your lifestyle quiz to find patterns across body systems. Code then checks every value, range and flag against what the laboratory reported. A clinician reviews the report before it is released to you.
Ultimate and Advanced reports arrive within 4 working days of your blood draw. Signature is processed at Randox Health and takes up to 12 working days.
Yes. The report has a GP section listing each finding worth raising, with the value and the laboratory limit, and it prints cleanly or saves as a PDF.
Your next report is written as a progress report. It compares every marker with your previous result, shows what improved and what moved the wrong way, and updates the guidance for the next three months.
No. The report explains what your results show and what to discuss with your GP. It does not diagnose conditions or replace medical care.
How it works Find a clinic All biomarkers Results explained Medical review policy
